Nasdaq Turns Neutral While S&P 500 Holds Bullish Lean
The Nasdaq slipped below a key moving average, flipping short-term momentum neutral. The S&P 500 faces a potential double-top but still leans bullish.
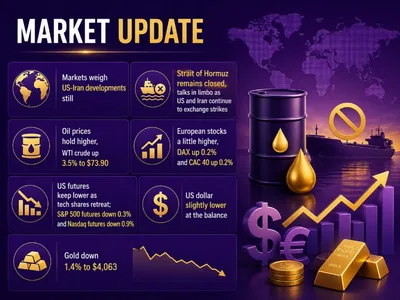
If you've been watching the markets today, things got a little wobbly — especially for tech. The Nasdaq Composite is off about 0.90% in early trading, while the S&P 500 is holding up a bit better with a smaller 0.40% dip. Not a disaster, but enough of a move to change the technical story for one of these indexes.
Here's the plain-English version of what's happening with the Nasdaq: it just slipped back below its 200-hour moving average (think of that as a short-term trend line that traders watch closely). That level sits around 26,088. Now the index is stuck in no-man's land — trading between the 200-hour moving average above and the 100-hour moving average below at roughly 25,874. When price is caught between those two levels, technicians call the bias "neutral," meaning neither buyers nor sellers have a clear edge. A push back above 26,088 would get the bulls excited again, but a drop below 25,874 would give the bears more ammunition.
Read more Big-Money Options Activity Spotted in 10 Tech Stocks Today →
The S&P 500 has its own drama going on. Friday's rally ran smack into resistance near 7,575.50 — the same swing high from June 15 — and sellers showed up right on cue. Today's gap lower is leaving what chartists call a potential "double-top" at that level, which is a bearish signal if confirmed. Basically, the market tried twice to break above that ceiling and failed both times. Still, the S&P hasn't broken down in a serious way yet; meaningful support doesn't kick in until the 200-hour moving average around 7,473 and the 100-hour moving average near 7,463, both of which are still a fair distance below current prices.
The bottom line: the Nasdaq needs to reclaim its 200-hour moving average to get back on track, while the S&P 500 is in a wait-and-see zone — bullish enough overall, but with a potential topping pattern that's worth keeping an eye on. Neither index is in full panic mode, but the mood has clearly shifted from last week's optimism.
Continue reading at Forexlive.